
S&P500 Volatility – The Return to Normality?
As we head into a new week, it’s worth taking pause to consider how the markets may behave in over the next few days. On the 5th Feb, the markets took a huge dive, and since that time have been extremely volatile.
Any increase or decrease in volatility requires traders to change their approach, so of course as the markets return to normal (slow down), we’ll need to keep in tune to that so that we don’t try to play volatility strategies on a calm market.
Trading on the S&P500 Futures on Thursday showed signs that the sort of speculative behavior we see on that market was back. Traders that in the most part had either abandoned the market or changed strategy appeared to be back with us.
Two of the more obvious ‘plays’ were here.
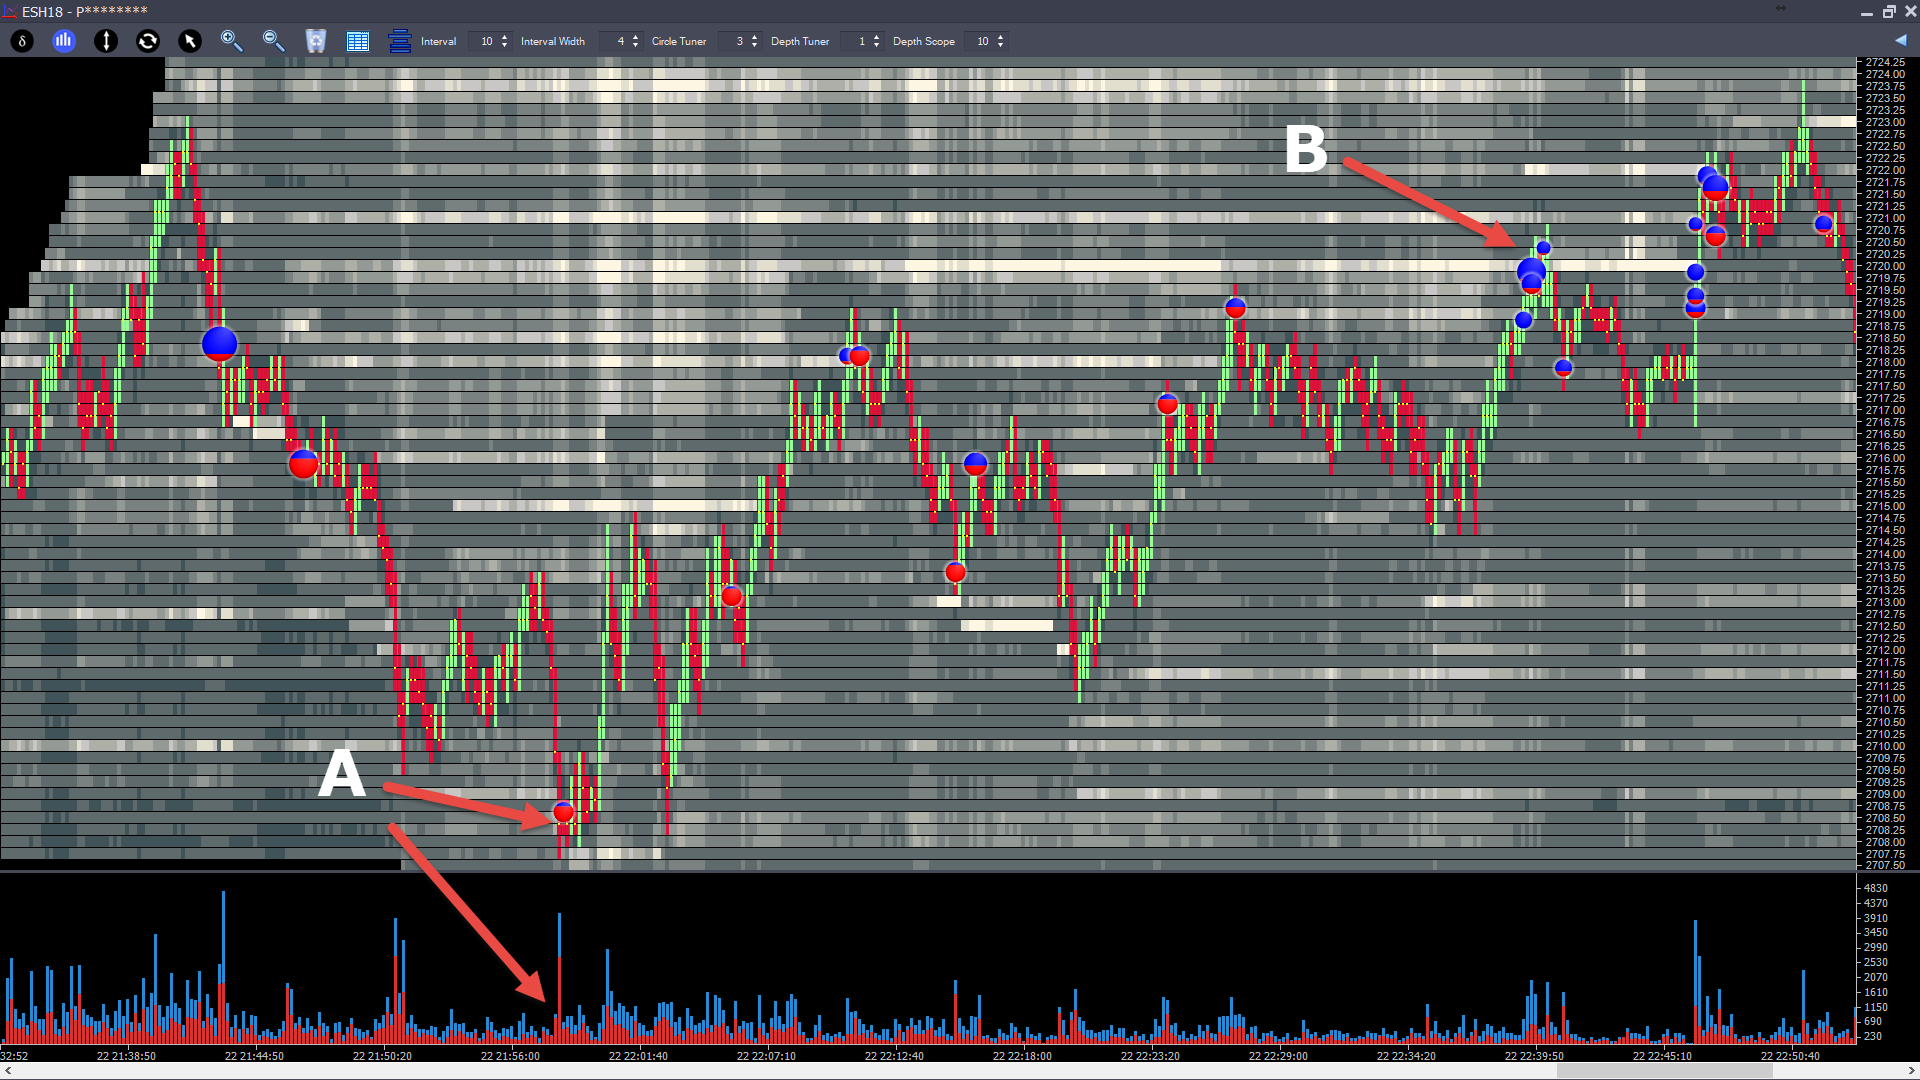 Auction Vista Chart 26th Feb (click for full size)
At point “A” – we can have a high volume spike which ended up being a short term reversal point. At point “B” – a very typical headfake up through an old level and then a push down – usually that’s to shake people into and then out of positions…
On a static chart like this, you don’t get to fully appreciate the moves playing out in real time, so you’ll have to take my word for the fact that this didn’t just feel like the market wildly whipping up and down but did feel like the way the S&P is played by short term speculators under normal conditions. So that’s our first factor to take into account.
The next is the VIX… 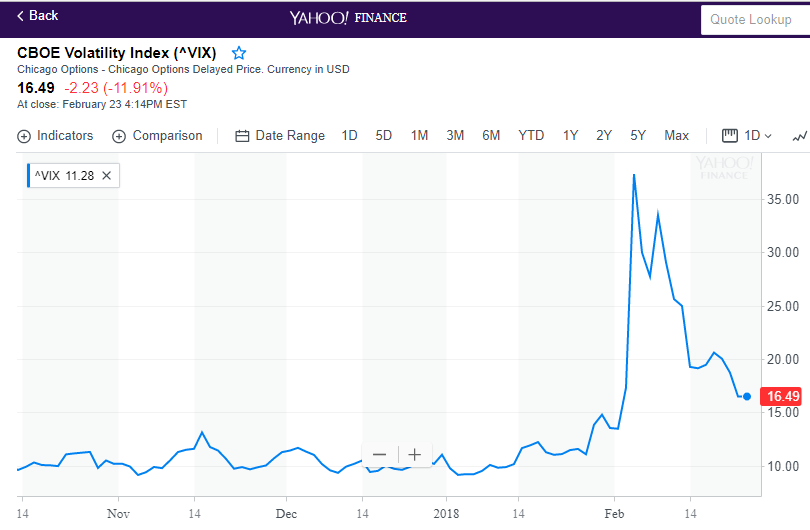
For those that don’t know this, it’s the CBOE (think options) Volatility Index. It uses S&P500 index options to measure the markets short term expectation of volatility.
We’ve discussed the VIX here before. In particular, how certain values seem to trigger the disappearance of a lot of liquidity (aka market depth). The theory being that market making algorithms likely de-risk and switch off/scale back when the market is considered more risky.
It used to be that when the VIX got over 24, we’d see a marked decrease in the amount of market depth which in turn would cause an increase in volatility (as it takes less market orders to ‘eat’ through each level of depth).
On 5th Feb the VIX spiked to 50. Now it’s back to 16.50. I personally think 12-13 is the ‘sweet spot’ in terms of giving us nice tradable days. Below 10 and it becomes painful on the slow side. From a VIX perspective, we are in definitely close to normal.
So from my perspective, I think it’s time to look at bringing back the regular S&P500 strategies. To confirm this, here’s how I’ll start off each day.
- From about 9am EST – watch where we’ve built areas of high volume leading up to the open.
- If we open on or near one of these areas, look for the usual short-term bounce they give us.
- Watch the overall volatility at the open too – it should be reasonably contained, a 10 point move in 3 minutes off the open would not indicate normal trading conditions.
- Watch the market depth per level. We need to see 300+ per level.
- Watch how much actual size it takes to get through each level. It’s normal to move through a level with less than 100 contracts but not every level – we want to see pauses and some prices with 3-400 contracts trading, indicating decent REAL liquidity existing at levels.
- Watch for ‘sweeps’ – the market sweeping a number of levels in a second or 2. Sweeps of 3-4 levels are OK but sweeps of 10 levels are not ‘back to normal’.
With these elements, we can make an assessment of whether the market is back to normal or if we should expect a wild swing day that is not indicative of ‘normal’ short term speculative action on the S&P.
Simplify Your Trading
Take a look into the decision making process of professional traders with this video training series that helps you make smarter trading decisions.


0 Comments